TOC
Introduction
Process
Accessing developer tool
Shortcuts
Anatomy
    Navigation sidebar
        Resources panel
        Storage
        Instrument
        Search
        Issue
        Debug
        Breakpoint
        Log
    Content browser
    Details sidebar
Introduction
Safari 6 web developer tool has substantial makeover from previous versions. It helps to prototype, debug and optimize web sites and safari extensions.
Process
Web development process can be generalized as follows. Developer tool can accelerate this process.
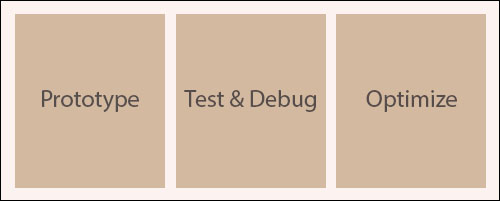
Prototype Prototype using HTML, CSS & javascript. Safari Snippet editor can help to create and test code snippets / functional modules. Use web Inspector console to find any errors in the code. User agent switcher will help to quickly check code is working as expected in different browsers and devices. Open site in other browsers and devices directly from safari develop menu.
Test & debug Test in different browsers and platforms. Web Inspector shows all the bugs and structural error in the code. Console, issue navigator, Breakpoint navigator, database navigator & log will help to identify error.
Optimize Tune your site for blazing performance by minimizing load time and avoiding performance bottlenecks. Instrument navigator provides tool to analyze and profile site. It shows how much time it take to load a particular resource, site latency due to any server side scripts, missing resources, css selector performance, javascript evaluating and rendering time etc..
Accessing developer tool
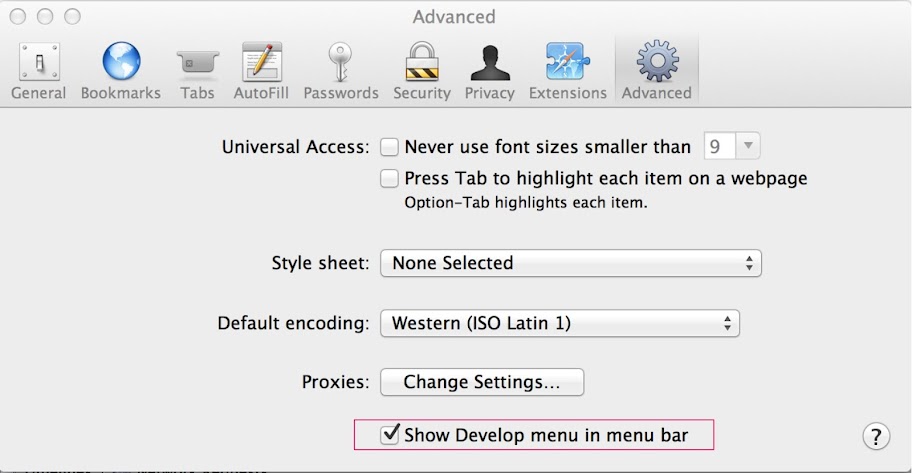
By default developer tool is not activated. Activate it from preference > advanced tab pane.
Safari developer tool shortcuts
Web Inspector : cmd + opt + I [mac] ctrl + alt + I [win]
Console : cmd + opt + c [mac] ctrl + alt + c [win]
Clear console : cmd + K or ctrl+ L [mac] ctrl + L [win]
Debugger
Step Out : F8 or cmd + shift + ;
Step Into : F7 or cmd + ;
Step over : F6 or cmd + ‘
Continue : cmd +/ or cmd+shift+y
Anatomy
Web developer is divided into 3 main sections.
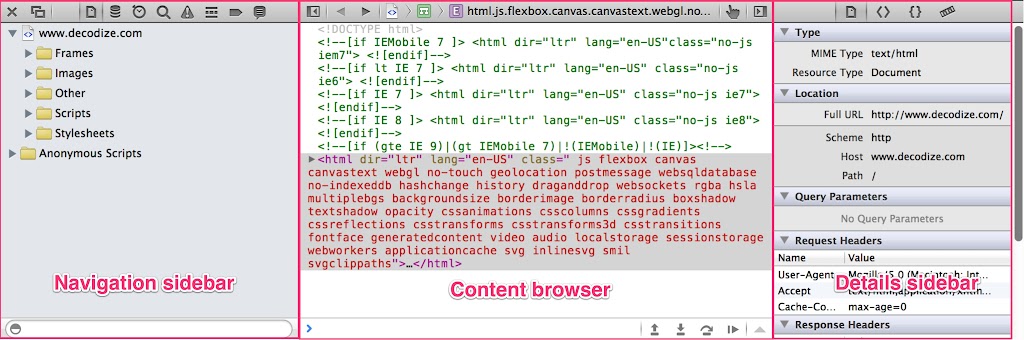
- Navigation sidebar
- Content browser
- Details sidebar
Navigation sidebar
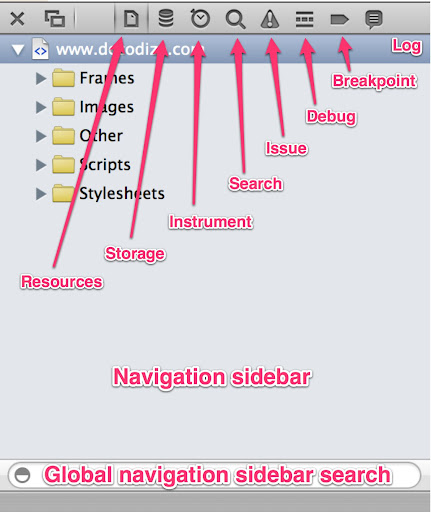
This pane hosts main sections of web developer tool. It has a global search to filter resources/items in the currently selected navigator item.
Example : typing “script” will reveal all file names contain script. *.min.js will filter all min javascripts.
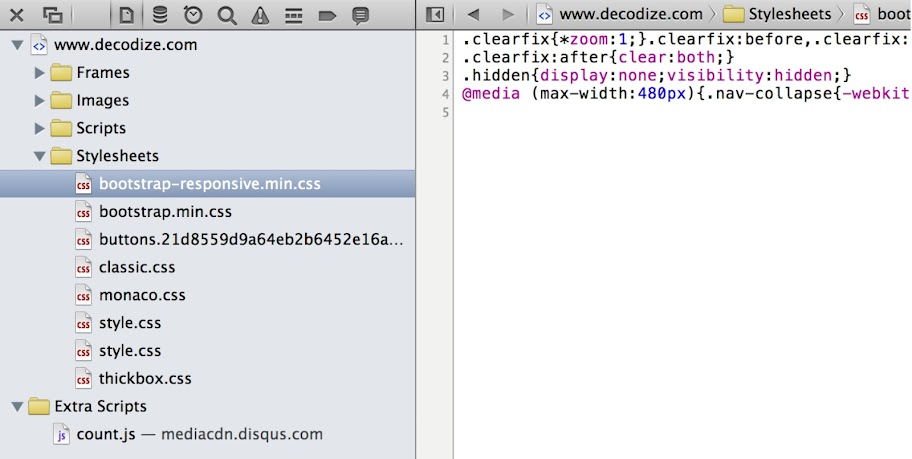
Resource panel It shows all the resources used in current site – images, scripts, frames, stylesheets etc.
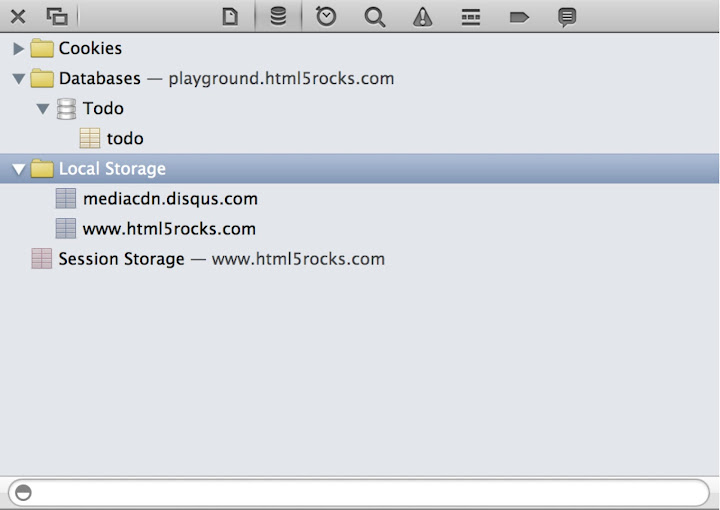
Storage Storage helps with debugging client side storage. You can inspect local key-value storage, offline application cache, web database and cookies. Now you can edit and delete local storage data. Indexed DB is missing. It is possible to execute SQL command against displayed database. One problem I noticed is the missing clear command.
Instrument Optimizing web site is a tedious job. You have to know which script is blocking the site, which resource is taking more bandwidth etc.. Instrument provides tool to mitigate optimization issues. Instruments gives us a total view of network requests, css layout calculations and rendering and javascript events involved.

- Network Request Timeline
- CSS Layout calculations
- Javascript & Events
When network is selected content browser will show all the detailed list of resources that took the bandwidth & time to took to load. Hovering each item in content browser will bring a small icon that leads to the exact resource. Ex: image, js etc..
Click on the circle to profile your javascript or CSS to know what causes the site performance issue.
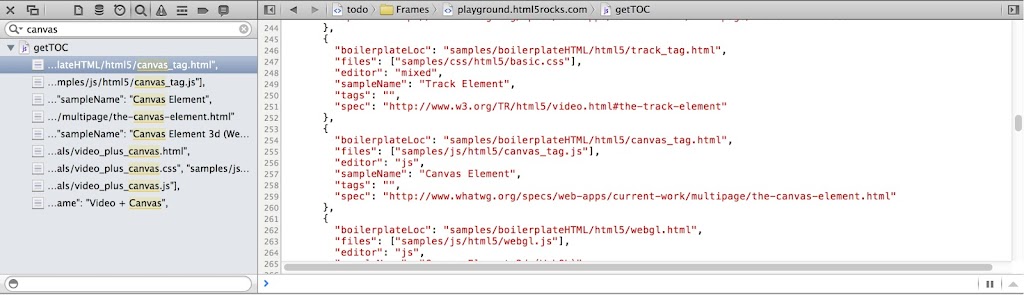
Search Search panel helps to search file contents.
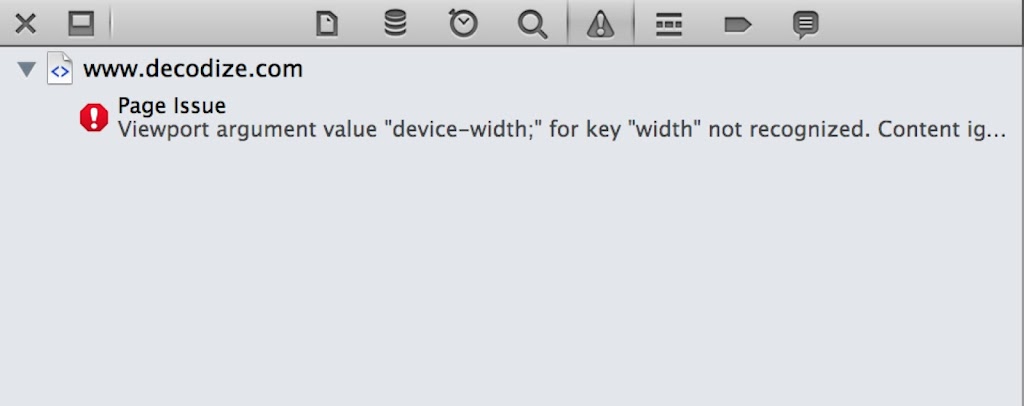
Issue Issues will list all the site structural and script issues. It shows all the errors encounter during the site load.
Debug Script execution can be paused and examined in debug navigator.
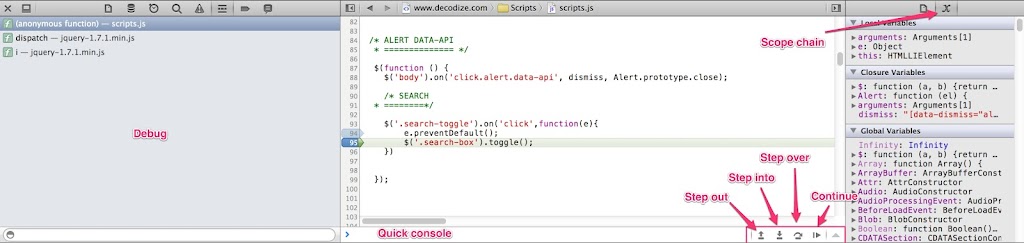
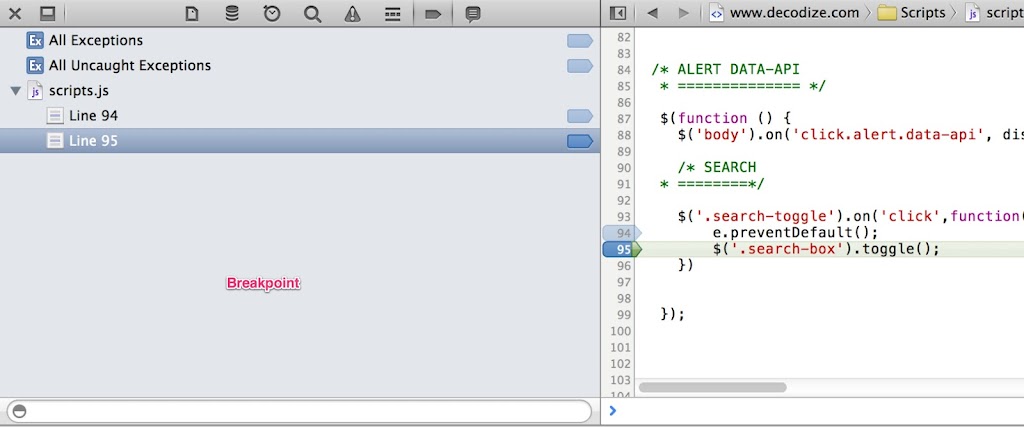
Breakpoint From resource navigator you can set breakpoints and can view the variables and call stacks.
Log It is the real console. There is a quick console and a log navigator. You can execute all console commands & scripts here.

Content browser
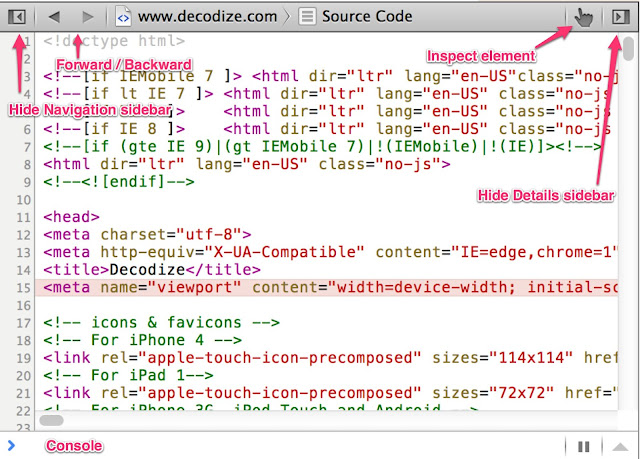
Content browser will show contents based on the selection made on the Navigator sidebar. You can access DOM of the current site from the content browser.
Details sidebar
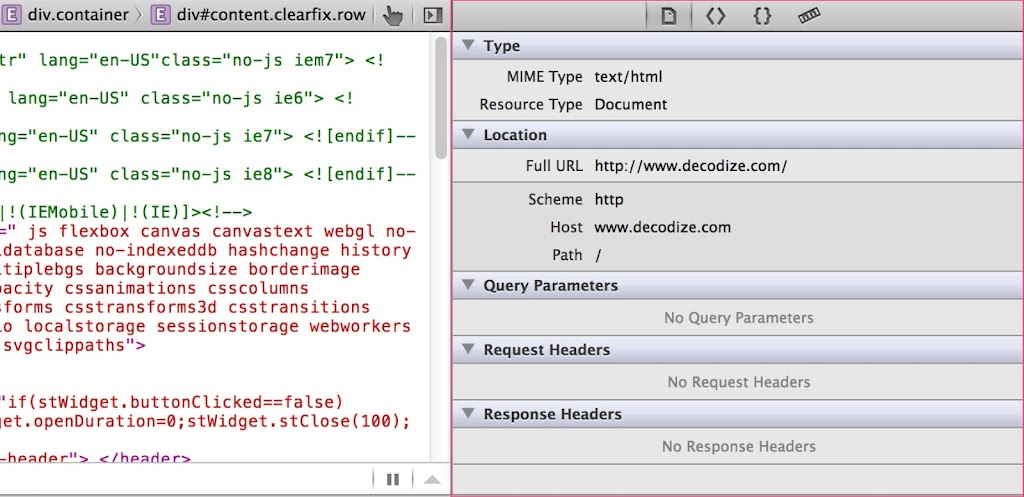
Based on the content browser selection this panel reveals the resource type, CSS properties, javascript events etc.. here.